Results
One quarter of subjects tested in the presence of androstanone
were unable to detect the heavily dosed androstanone strip (n=10): data
from these subjects were discarded and replacement subjects were found. Two
subjects in one of the no-audience conditions used the computer to help them
produce unnaturally high scores in the trials, and their results were likewise
discarded and replaced. None of the subjects when asked claimed to have detected
any scent or other abnormality with any of the materials in the testing chamber.
Most believed that the anosmic chamber was used because one could use it to
isolate subjects from distracting stimuli.
Hypothesis One
| HA-1 |
"Subjects will
type significantly more characters in the easy task than in the hard task" |
Table 1 shows the mean, minimum and maximum number of characters
typed (the score) by all subjects for both tasks and the standard deviation.
Figure 1 shows a boxplot graph of the distribution of scores by task. The table
and figure shows a much higher mean score for the easy task than it does for
the hard task, so this suggests support for alternative hypothesis 1.
Table 1. Descriptive statistics for the Task Difficulty
factor
|
Easy Task |
Hard Task |
| Mean |
1021.11 |
164.95 |
| Minimum |
488 |
113 |
| Maximum |
2045 |
248 |
| S.D. |
328.87 |
32.34 |
Note: n=80. The difference between the means of the
two levels of task difficulty was highly significant (p < 0.0005)
Figure 1. Boxplot to show the distribution
of scores for each level of task difficulty
 |
Note the much higher scores for the easy
task than the hard task.
Note also the much wider distribution of scores in
the easy task. After taking the different sizes of the means into
account, the S.D. for the easy task is still more than 50% bigger than
that of the hard task. This suggests it was not a consistently easy
task for subjects to perform.
|
|
A 2 x 2 x 2 repeated measures ANOVA revealed a highly significant
main effect of task difficulty on task performance F (1,76) = 659.76,
p <0.0005. Hypothesis HA-1 is retained.
Hypothesis Two
| HA-2 |
"Subjects
tested in the presence of an observer will type significantly more characters
in the easy task and significantly fewer characters in the hard task than
subjects who are not tested in the presence of an observer" |
Table 2 shows the means, minima, maxima and standard deviations
for both the easy and hard tasks in the audience and no audience treatments.
It can be seen from the means that, as predicted, in the audience condition
subjects typed more characters in the easy task and fewer characters in the
hard task than they did in the no audience condition. Figure 2 represents these
means side by side. Note in this graph that in the audience treatment there
is a noticeable trend for easy task scores to be higher and hard task scores
to be lower than in the no audience treatment. The repeated measures ANOVA showed
a significant interaction between audience treatment and task difficulty, F
(1,76) = 11.37, p < 0.005. From this interaction and the direction
of the difference in means (see Figure 2 and Table 2) hypothesis HA-2
can be retained.
Table 2. Descriptives for the Audience treatment and Task
Difficulty.
|
|
Audience |
No Audience |
| Easy Task |
Mean |
1128.32 |
913.9 |
| Minimum |
562 |
488 |
| Maximum |
2045 |
1411 |
| S.D.. |
368.62 |
244.18 |
| Hard
Task |
Mean |
157.13 |
172.78 |
| Minimum |
113 |
123 |
| Maximum |
209 |
248 |
| S.D.. |
26.69 |
35.78 |
n=40. Note the differences between the means: in the
audience treatment the subjects scored more highly on the easy task and less
higly on the hard task than did subjects with no audience. This difference was
significant (p < 0.005)
Figure 2. Boxplots to show Audience effects
on Easy and Hard tasks
 |
 |
Note in the audience treatment the scores
are higher for the easy task and lower for the hard task than in the No
audience treatment. This is consistent with the predicted (and already
well established in literature) effect of social faciliation. The
differences here are significant (p < 0.005)
|
|
Hypothesis Three
| HA-3 |
"Subjects
tested in the presence of androstanone will type significantly more characters
in the easy task and significantly fewer characters in the hard task than
subjects who are not tested in the presence of androstanone" |
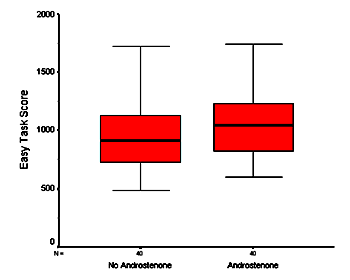
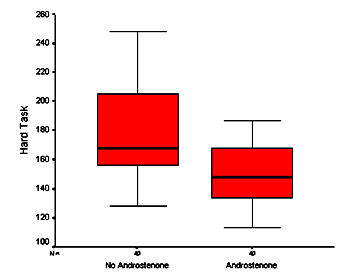
Table 3 shows the means, minima, maxima and standard deviations
for each task difficulty across both levels of androstanone treatment. The subjects'
mean score is higher for the easy task and lower for the hard task in the androstanone
treatment than in the no androstanone treatment. Figure 3 represents this in
a side by side boxplot of scores in the easy and hard tasks against the levels
of androstanone treatment.
Table 3. Descriptives for the Androstanone treatment and
Task Difficulty.
|
|
Androstanone |
No Androstanone |
| Easy
Task |
Mean |
1064.95 |
977.28 |
| Minimum |
602 |
488 |
| Maximum |
1901 |
2045 |
| S.D. |
304.02 |
350.3 |
| Hard
Task |
Mean |
149.37 |
180.53 |
| Minimum |
113 |
128 |
| Maximum |
187 |
248 |
| S.D. |
21.38 |
34.11 |
Note: The differences in the means and direction of these
differences suggest that there may be an interaction between androstanone and
task difficulty. However, in this experiment, no significant interaction was
found (p > 0.05)
Figure 3. Boxplots to show Androstanone effects
on Easy and Hard tasks
 |
 |
|
|
Note in the androstanone treatment the scores are higher
for the easy task and lower for the hard task than in the no androstanone
treatment. This is consistent with the predicted effect, but a repeated
measures ANOVA found it to be non-significant (p > 0.05)
|
A repeated measures ANOVA did not confirm this relationship
F (1,76) = 3.024, p > 0.05, so at this stage the third alternative
hypothesis must be rejected, and null hypothesis H0-3
retained. However, given the relatively high S.D. (even accounting for the means
being larger) of the easy task scores when compared with the hard task scores,
it was thought that separate analysis of the effect of androstanone on each
task's individual mean might reveal a significant effect. While analysis showed
there was no significant effect of androstanone on scores in the easy task,
a one-way ANOVA showed there was a highly significant effect of the androstanone
treatment on scores in the hard task, F (1,78) = 23.953, p <
0.005. In the light of the significant effect of androstanone on the subjects
performance in the hard task alone, hypothesis HA-3
can be partially retained. While subjects in the presence of androstanone did
not type significantly more characters in the easy task than those who were
not in the presence of androstanone, they did type significantly more
characters in the hard task.
It is possible that a significant effect of androstanone
presence on scores in the easy task may have been found had the sample size
been larger. Maxwell and Delaney (1990) provide a method of determining the
sample size required to show a significant effect of a certain power, given
the predicted difference between means. Using power = 0.8 it is possible to
use this method to determine what number of subjects this design would require,
given the difference between the easy task means across both levels of the androstanone
treatment. Where MA is the mean for the androstanone treatment and MNA is the
mean with no androstanone, we can determine a value for d and look it
up against the tables provided by Maxwell and Delaney:
The difference between the means in the easy task is 87.69.
The S.D. is 328.87, so d is 0.26. The table shows that approximately
250 subjects would be required to achieve a significant effect (power = 0.8)
given the small difference between means of the different treatments and the
large variance between individuals' scores on the easy task.
When the subjects' sex was included in the statistical model
(making a 2 x 2 x 2 x 2 within-between design) an interaction between subjects'
sex and audience treatment emerged as significant F (1,72) = 5.047, p
< 0.05. Examination of the means (see Table 4) reveals that men without an
audience typed many more characters in the hard task than did women with or
without an audience, or men with an audience. Table 4 also shows contrapositive
findings: the mean score for women with an audience was higher in the easy task
than for men with or without an audience, and women without one.
Table 4. Descriptives for the interaction Task Difficulty
* Audience * Sex
|
|
|
Mean |
Min |
Max |
S.D. |
| Easy |
Men |
Audience |
1019.6 |
725 |
1377 |
202.94 |
| No Audience |
967.55 |
614 |
1344 |
216.83 |
| Women |
Audience |
1237.05 |
562 |
2045 |
461.35 |
| No Audience |
860.25 |
488 |
1411 |
263.28 |
|
|
|
|
|
|
|
| Hard |
Men |
Audience |
155.86 |
113 |
209 |
28.41 |
| No Audience |
183.75 |
123 |
248 |
44.47 |
| Women |
Audience |
158.39 |
115 |
209 |
25.53 |
| No Audience |
161.8 |
133 |
201 |
19.91 |
Note: for each mean, n=20. The numbers in bold are
those discussed below
This table shows the two treatment-task combinations with
the very high means (men * no audience * hard task and women * audience * easy
task) also have higher then normal standard deviations and maximum values, suggesting
that outlying data may have lead to this interaction being significant. Indeed,
there are a small number of outlying data points in all treatments, but, after
checking for clerical errors, it was determined that these points were genuine
data, and so were retained in the analysis. However, conducting the same ANOVA
without the most extreme data points resulted in no significant interaction
of task difficulty, audience and sex, F (1,66) = 3.1, p > 0.05,
whereas all other interactions remained at similar p values.
Turn to the Discussion...


